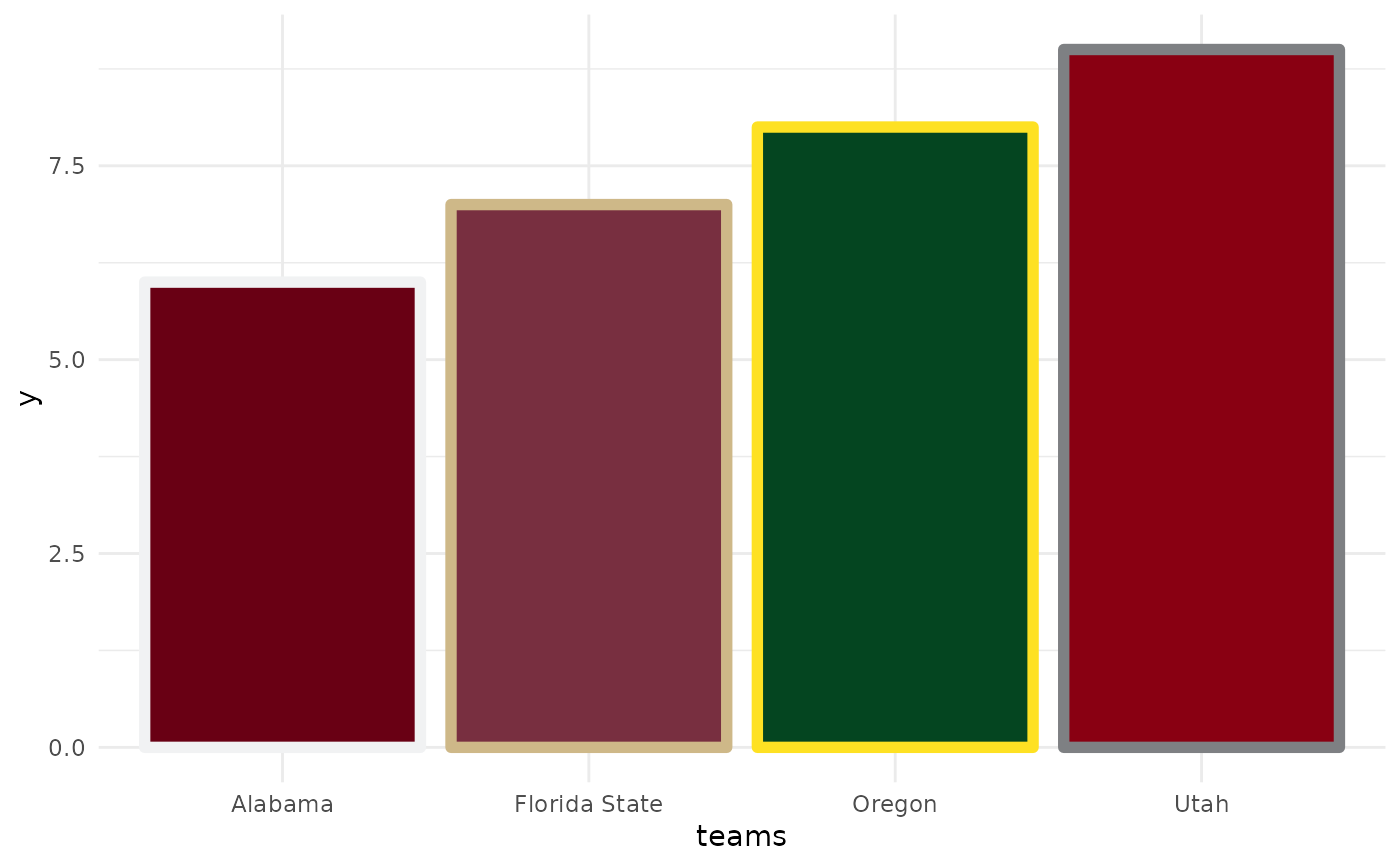
These functions allows you to map college football team names as levels to the color and fill aesthetics
Usage
scale_color_cfb(
  alt_colors = NULL,
  values = NULL,
  ...,
  aesthetics = "colour",
  breaks = ggplot2::waiver(),
  na.value = "grey50",
  guide = NULL,
  alpha = NA
)

scale_colour_cfb(
  alt_colors = NULL,
  values = NULL,
  ...,
  aesthetics = "colour",
  breaks = ggplot2::waiver(),
  na.value = "grey50",
  guide = NULL,
  alpha = NA
)

scale_fill_cfb(
  alt_colors = NULL,
  values = NULL,
  ...,
  aesthetics = "fill",
  breaks = ggplot2::waiver(),
  na.value = "grey50",
  guide = NULL,
  alpha = NA
)
Arguments
- alt_colors
Vector of team names to use the alternate color of.
- values
If
NULL(the default) use the internal team color vectors. Otherwise a set of aesthetic values to map data values to. The values will be matched in order (usually alphabetical) with the limits of the scale, or withbreaksif provided. If this is a named vector, then the values will be matched based on the names instead. Data values that don't match will be givenna.value.- ...
Arguments passed on to scale_color_manual
- aesthetics
Character string or vector of character strings listing the name(s) of the aesthetic(s) that this scale works with. This can be useful, for example, to apply colour settings to the
colourandfillaesthetics at the same time, viaaesthetics = c("colour", "fill").- breaks
One of:
NULLfor no breakswaiver()for the default breaks (the scale limits)A character vector of breaks
A function that takes the limits as input and returns breaks as output
- na.value
The aesthetic value to use for missing (
NA) values- guide
A function used to create a guide or its name. If
NULL(the default) no guide will be plotted for this scale. Seeggplot2::guides()for more information.- alpha
Factor to modify color transparency via a call to
scales::alpha(). IfNA(the default) no transparency will be applied. Can also be a vector of alphas. All alpha levels must be in range[0,1].
Examples
library(cfbplotR)
library(ggplot2)

df <- data.frame(
  y = 6:9,
  teams = c("Alabama","Florida State","Oregon","Utah")
 )
 ggplot(df, aes(x = teams, y = y)) +
   geom_col(aes(color = teams, fill = teams), size = 2) +
   scale_color_cfb(alt_colors = df$teams) +
   scale_fill_cfb() +
   theme_minimal()
#> Warning: Using `size` aesthetic for lines was deprecated in ggplot2 3.4.0.
#> ℹ Please use `linewidth` instead.
